MS Imaging Biomarkers
Accurately determining the location and spread of MS lesions throughout the brain is critical to diagnose and monitor disease progression.

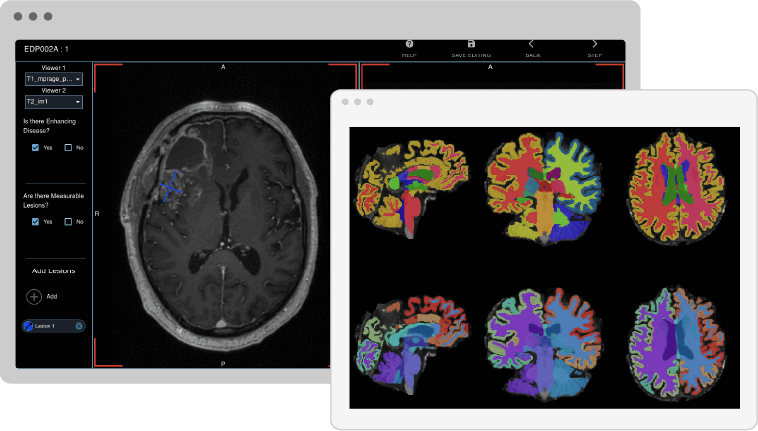
Visual Detection and Categorization of White Matter Lesions
The process of visually detecting, categorizing, and segmenting white matter lesions can be highly time-consuming and inconsistent among readers, yet it's essential in tracking neurological conditions like multiple sclerosis. To aid this process, the QMENTA platform offers a highly configurable viewer with various capabilities such as quality checking, ROI drawing, label editing, annotations, synchronized volumes, and visualization of dynamic sequences. By integrating web viewers with diverse options, the platform not only saves time but also promotes greater standardization, making it an invaluable tool for medical professionals.
Quantitative Susceptibility Mapping (QSM)
A subset of lesions in MS, characterized by a paramagnetic rim from iron-laden microglia, negatively impacts clinical outcomes. Iron-sensitive techniques like gradient echo (GRE) MRI and quantitative susceptibility mapping (QSM) are crucial for detecting and monitoring these lesions.(12)
Changes in Brain Volume as detected by MRI
Patients with multiple sclerosis (MS) experience varying degrees of gray matter atrophy beyond normal aging. The QMENTA platform's tools enable quantification of region-specific atrophy and thickness, utilizing processing tools like FreeSurfer, ANTs, and SIENAX, allowing longitudinal assessment of gray matter atrophy. (5)
Interested in our MS biomarkers?
Explore our comprehensive range of specialized tools
All within one convenient and user-friendly interface
1. Schmidt, P., Gaser, C., Arsic, M., Buck, D., Förschler, A., Berthele, A., ... & Hemmer, B. (2012). An automated tool for detection of FLAIR-hyperintense white-matter lesions in multiple sclerosis. Neuroimage, 59(4), 3774-3783.
2. Egger, Christine, et al. "MRI FLAIR lesion segmentation in multiple sclerosis: Does automated segmentation hold up with manual annotation?." NeuroImage: Clinical 13 (2017): 264-270. Image source: Caroline Köhler, et al. “Exploring individual multiple sclerosis lesion volume change over time: Development of an algorithm for the analyses of longitudinal quantitative MRI measures.” NeuroImage: Clinical (2019).
3. Klistorner, Alexander, et al. "Decoding diffusivity in multiple sclerosis: analysis of optic radiation lesional and non-lesional white matter." PLoS One 10.3 (2015): e0122114.Image source: Huang SY, at al. “Characterization of Axonal Pathology Independent of Fiber Crossings in Multiple Sclerosis Using High-Gradient Diffusion MRI.”(2016)
4. Klistorner, Alexander, et al. "Diffusivity in multiple sclerosis lesions: At the cutting edge?." NeuroImage: Clinical 12 (2016): 219-226.
5. Rocca, M. A. et al. (2017). Brain MRI atrophy quantification in MS. Neurology, 88(4), 403–413. https://doi.org/10.1212/WNL.0000000000003542
6. Hemond, Christopher C., and Rohit Bakshi. "Magnetic resonance imaging in multiple sclerosis." Cold Spring Harbor perspectives in medicine 8, no. 5 (2018): a028969.
7. Coronado, Ivan, Refaat E. Gabr, and Ponnada A. Narayana. "Deep learning segmentation of gadolinium-enhancing lesions in multiple sclerosis." Multiple Sclerosis Journal 27, no. 4 (2021): 519-527.
8. Kazancli, Erol, Vesna Prchkovska, Paulo Rodrigues, Pablo Villoslada, and Laura Igual. "Multiple Sclerosis Lesion Segmentation using Improved Convolutional Neural Networks." In VISIGRAPP (4: VISAPP), pp. 260-269. 2018.
9. Moccia, Marcello, Nicola de Stefano, and Frederik Barkhof. "Imaging outcome measures for progressive multiple sclerosis trials." Multiple Sclerosis Journal 23, no. 12 (2017): 1614-1626.
10. Giorgio, Antonio, Marco Battaglini, Giordano Gentile, Maria Laura Stromillo, Claudio Gasperini, Andra Visconti, Andrea Paolillo, and Nicola De Stefano. "Mapping the progressive treatment-related reduction of active MRI lesions in multiple sclerosis." Frontiers in Neurology 11 (2020): 1466. Image source: Giorgio, Antonio et al. “Mapping the Progressive Treatment-Related Reduction of Active MRI Lesions in Multiple Sclerosis.” Frontiers in Neurology (2020).
11. Ontaneda, D., P. Sati, P. Raza, M. Kilbane, E. Gombos, E. Alvarez, C. Azevedo et al. "Central vein sign: A diagnostic biomarker in multiple sclerosis (CAVS-MS) study protocol for a prospective multicenter trial." NeuroImage: Clinical 32 (2021): 102834. Source: Sati, P. et al. “The central vein sign and its clinical evaluation for the diagnosis of multiple sclerosis: a consensus statement from the North American Imaging in Multiple Sclerosis Cooperative.” Nat Rev Neurol (2016). 12. Absinta M, Sati P, Masuzzo F, et al. Association of Chronic Active Multiple Sclerosis Lesions With Disability In Vivo. JAMA Neurol. 2019;76(12):1474–1483.