Dementia & Alzheimer’s Imaging Biomarkers
Advanced digital imaging biomarkers for measuring brain anatomy, disease progression, and treatment effectiveness: all in one simple solution.


AI-powered Imaging for Your Research
Alzheimer's disease, a complex, and progressive neurodegenerative disorder, poses significant challenges to healthcare providers and researchers alike. Imaging biomarkers have emerged as a vital tool in the early detection and characterization of this devastating disease. By leveraging advanced imaging techniques, researchers are now able to visualize and quantify structural, functional, and molecular changes in the brain that may precede noticeable cognitive decline. This page showcases an array of these pioneering imaging biomarkers for Alzheimer’s, providing an in-depth look at how they are transforming our understanding, diagnosis, and potential treatment of a condition that affects millions worldwide.
Resting state fMRI seed-based connectivity measures
A reliable biomarker for characterizing Alzheimer's Disease (AD) and related dementia like Mild Cognitive Impairment, with the default mode network commonly affected. QMENTA's seed-based analysis tools enable identification of changes in the DMN's resting state connectivity.
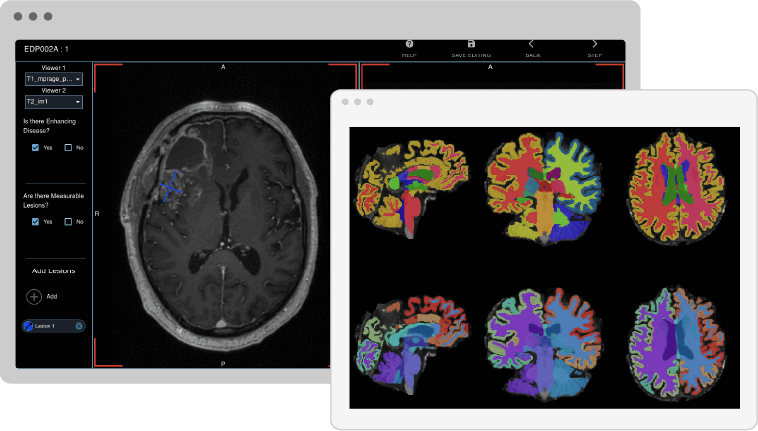
Longitudinal Volumetric MRI
Whole brain volume is a prevalent imaging endpoint in Alzheimer's clinical trials, and changes in volume or thickness can be significant biomarkers for disease detection and progression. Our gray matter volumetry tools enable region-specific quantification and longitudinal assessment. (16,17,18,19)
Resting state fMRI non-connectivity physiological maps
The non-connectivity physiological maps, such as regional homogeneity (ReHO), ALFF, and fractional ALFF, are useful in characterizing AD and detecting neurodegeneration. Our resting state fMRI physiological maps provide automated tools for estimation and quantification across different brain regions.
Change in MRI white matter free water content as a proxy for neuroinflammation
Recent studies link neuroinflammation in neurological diseases to white matter free water modeling from diffusion MRI. The progressive increase in white matter free water levels from healthy to Alzheimer's suggests its potential as a biomarker for cognitive decline.
Change in MRI Apparent Fiber Density as a proxy for changes in white matter quality
Apparent Fiber Density, a new metric, surpasses standard diffusion metrics like Fractional Anisotropy by identifying specific neuronal tissue features. It's derived from complex diffusion modeling and has shown promise in Alzheimer's characterization, pinpointing decreases in Apparent Fiber Density in areas vital to memory and cognition, with improved specificity over traditional methods. (Image 1)
Amyloid PET
Amyloid PET assesses brain amyloid deposition, a process that is believed to precede neurodegeneration in Alzheimer's disease. By quantitatively computing uptake value ratios through combined MRI and PET imaging, it may serve as an excellent biomarker for the early detection of Alzheimer's. (Image 3)
White matter integrity by diffusion tensor imaging (DTI)
Diffusion-weighted imaging is a promising Alzheimer's biomarker that reveals white matter changes. Our automated tools allow for extensive analysis, including the evaluation of measures like fractional anisotropy, radial diffusivity, and axial diffusivity in specific regions or white-matter tract statistics. (20,21)
Curious about our cutting-edge Alzheimer's biomarkers?
Take a look at the full range of Alzheimer's Imaging Biomarkers
Easily accessible with just a few clicks
14. Henneman, W. J. P., Sluimer, J. D., Barnes, J., Van Der Flier, W. M., Sluimer, I. C., Fox, N. C., ... & Barkhof, F. (2009). Hippocampal atrophy rates in Alzheimer disease added value over whole brain volume measures. Neurology, 72(11), 999-1007.
15. De Jong, L. W., Van der Hiele, K., Veer, I. M., Houwing, J. J., Westendorp, R. G. J., Bollen, E. L. E. M., ... & Van Der Grond, J. (2008). Strongly reduced volumes of putamen and thalamus in Alzheimer's disease: an MRI study. Brain, 131(12), 3277-3285.
16. Cash, David M., et al. "Imaging endpoints for clinical trials in Alzheimer’s disease." Alzheimer's research & therapy 6.9 (2014): 87.
17. Querbes, Olivier, et al. "Early diagnosis of Alzheimer's disease using cortical thickness: impact of cognitive reserve." Brain 132.8 (2009): 2036-2047.
18. Racine, Annie M., et al. "The personalized Alzheimer's disease cortical thickness index predicts likely pathology and clinical progression in mild cognitive impairment." Alzheimer's & Dementia: Diagnosis, Assessment & Disease Monitoring 10 (2018): 301-310.
19. Dickerson, Bradford C., et al. "The cortical signature of Alzheimer's disease: regionally specific cortical thinning relates to symptom severity in very mild to mild AD dementia and is detectable in asymptomatic amyloid-positive individuals." Cerebral cortex 19.3 (2008): 497-510.
20. Douaud, Gwenaëlle, et al. "DTI measures in crossing-fibre areas: increased diffusion anisotropy reveals early white matter alteration in MCI and mild Alzheimer's disease." Neuroimage 55.3 (2011): 880-890.
21. Zhang, Y., et al. "Diffusion tensor imaging of cingulum fibers in mild cognitive impairment and Alzheimer disease." Neurology 68.1 (2007): 13-19.
22. Lo, Chun-Yi, et al. "Diffusion tensor tractography reveals abnormal topological organization in structural cortical networks in Alzheimer's disease." Journal of Neuroscience 30.50 (2010): 16876-16885.
Image Source:
1: David Raffelt, et al. “Apparent Fibre Density: A novel measure for the analysis of diffusion-weighted magnetic resonance images.” NeuroImage (2012)
2: Marcus, Charles et al. “Brain PET in the diagnosis of Alzheimer's disease.” Clinical nuclear medicine (2014)
3:“Amyloid PET Scan for Alzheimer's Disease Assessment". UCSF, radiology.ucsf.edu
4: Fichou, Yann, et al. “The elusive tau molecular structures: can we translate the recent breakthroughs into new targets for intervention?.” Acta Neuropathologica Communications (2019)
5: Qunxi Dong, et al. “Applying surface-based morphometry to study ventricular abnormalities of cognitively unimpaired subjects prior to clinically significant memory decline.” NeuroImage: Clinical (2020)
6:Tang, Xiaoying, et al. “Segmentation of brain magnetic resonance images based on multi-atlas likelihood fusion: Testing using data with a broad range of anatomical and photometric profiles”. Frontiers in neuroscience (2015)