Advanced Solutions for Neuro-Oncology Research
Cutting-edge solutions for thorough brain tumor examination.


Dedicated to Innovate
In 2023, the National Brain Tumor Society expects about 87,500 people to be diagnosed with brain tumors, with roughly 26,300 of these being cancerous, our work has never been more critical. Emphasizing the growing importance of biomarkers in the diagnosis and management of brain tumors. Our unique tools, like the Digital RANO, allow you to use imaging biomarkers to help us understand important parts of the tumor. These tools can tell the difference between tumor and non-tumor areas and measure things like blood flow, giving us a clear picture of the tumor and how it might affect nearby tissue.
RANO Assessment Tool
Our Digital RANO tool automatically organizes time points and configures itself for easy analysis. Users can draw callipers on the image, with previous sessions displayed for reference. The tool then adjusts metadata or eCRF fields based on the callipers' measurements, streamlining the individual assessment process.
Brain Tumor Volume Quantification
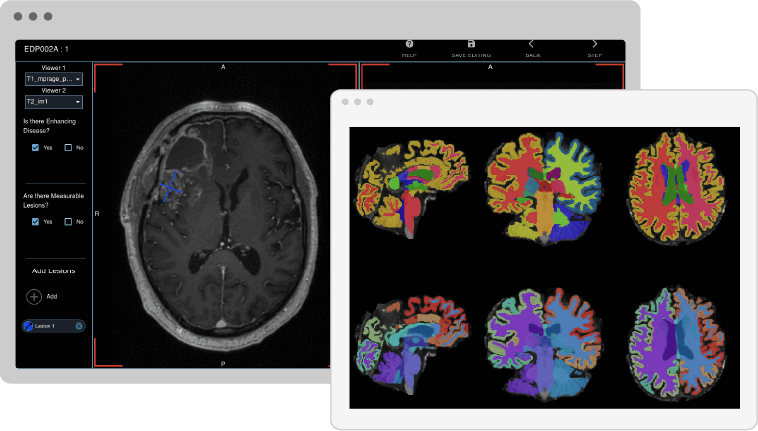
Our AI-powered Q-BTS, Brain Tumor Segmentation, tool provides an automated solution for brain tumor contouring, segmenting gliomas and glioblastomas using contrast-enhanced images and deep neural networks. Analyzing T1 and T2 weighted images, it offers detailed insights into each tumor part, enabling efficient monitoring of tumor progression.
Radiomics
Extracts a series of radiomic features over various tissues and regions of interest, designed primarily for oncology images characterization. Key features include First Order Features, Shape Features, GLCM, GLSZM, GLRLM, NGTDM, GLDM, Wavelet, Laplacian of Gaussian (with extra parameters), Sigma, Filter width, Logarithm, and Exponential.
IB DCE™
The IB DCE™ software, including version 2.0, analyzes T1 weighted images to create valuable perfusion and permeability parameters like Ktrans, Ve, Vp, and others. Using models such as extended Tofts, Tofts, and Patlak, it offers automatic selection for AIF/VIF and a quality assurance step, sharing the same interface with other IB products, enhancing usability.
Gadolinium Deposition
QMENTA's automatic quantification process detects changes in tissue's magnetic properties due to gadolinium deposition. By integrating segmentation with quantitative maps, it facilitates the analysis of gadolinium deposition in patients after contrast-enhanced imaging. (Image 1)
Contrast Enhanced Imaging – IB Delta Suite™
T1-weighted imaging, using pre-post contrast Delta T1 quantification, differentiates between perfused and non-perfused regions of tumor tissue. This allows for monitoring of tumor changes in patients treated with anti-angiogenesis agents, among other capabilities. (37, 38)
Perfusion Imaging – IB Neuro™
IB Neuro™ v2.0 analyzes dynamically acquired MR datasets to generate parametric perfusion maps, quantifying contrast changes over time. It fits both routine clinical and research workflows, addressing advanced needs.
IB Diffusion™
IB Diffusion™ v2.0 is software designed to analyze MR diffusion-weighted images (DWI) and generate Apparent Diffusion Coefficient (ADC) maps. ADC values have proven to be useful in both the initial diagnosis and ongoing treatment monitoring of all solid tumors.
Interested in our Neuro-Oncology Biomarkers?
Discover our extensive collection of cutting-edge Neuro-oncology Biomarkers and AI-Enhanced Tools
37. Warmuth, Carsten, Matthias Gunther, and Claus Zimmer. "Quantification of blood flow in brain tumors: comparison of arterial spin labeling and dynamic susceptibility-weighted contrast-enhanced MR imaging." Radiology 228.2 (2003): 523-532.
38. Jackson, Alan, and David L. Buckley. Dynamic contrast-enhanced magnetic resonance imaging in oncology. Ed. Geoffrey JM Parker. Berlin: Springer, 2005.
39. Çoban, G., et al. "Prognostic value of dynamic susceptibility contrast-enhanced and diffusion-weighted MR imaging in patients with glioblastomas." American Journal of Neuroradiology (2015).
40. Lee, B., et al. "Clinical Value of Vascular Permeability Estimates Using Dynamic Susceptibility Contrast MRI: Improved Diagnostic Performance in Distinguishing Hypervascular Primary CNS Lymphoma from Glioblastoma." American Journal of Neuroradiology (2018).
National brain tumor association.
Image Source:
1: J. Ramalho, et al. “Gadolinium-Based Contrast Agent Accumulation and Toxicity: An Update”. American Journal of Neuroradiology (2016).